
Dubai Investment Park Second vs Dubai Production City:
Which Is Better to Live In?
Data-driven comparison of two popular Dubai areas. Compare rent prices, property values, yields, lifestyle, and commute to make an informed decision.
1BR rents in Dubai Investment Park Second are 14% lower than in Dubai Production City (DLD Ejari, Nov 2025 – Nov 2026, 3,430 leases).
Our Verdict
Dubai Investment Park Second is about 14% cheaper to rent: a 1BR costs AED 50K a year, against AED 58K in Dubai Production City. Homes sell for less in Dubai Production City, though: a median AED 687K, against AED 1.12M in Dubai Investment Park Second. Dubai Investment Park Second offers higher rental yields, making it potentially better for investors seeking returns.
Dubai Investment Park Second
- Median 1BR Rent/Year
- AED 50K
- Median Home Price
- AED 1.12M(apartments)
- Transactions
- 9,224
Dubai Production City
- Median 1BR Rent/Year
- AED 58K
- Median Home Price
- AED 687K(apartments)
- Transactions
- 18,798
Quick Comparison
| Metric | Dubai Investment Park Second | Dubai Production City | Difference |
|---|---|---|---|
| Median 1BR Rent/Year | AED 50K | AED 58K | Dubai Investment Park Second lower |
| Rental Yield | 8.6% | 8.5% | Dubai Investment Park Second higher |
| Median Home Price | AED 1.12Mapartments | AED 687Kapartments | Dubai Production City lower |
| Transactions | 9,224 | 18,798 | Dubai Production City higher |
| Sales and rent figures for Dubai Production City cover the whole DLD area Me'Aisem First, which includes neighbouring communities. | |||
| Metro Access | Data not available | No metro station within 3 km | — |
Rent by Apartment Size
| Size | Dubai Investment Park Second | Dubai Production City |
|---|---|---|
| Studiounder 50 sqm | AED 35K | AED 38K |
| 1BR50-90 sqm | AED 50K | AED 58K |
| 2BR90-145 sqm | AED 61K | AED 79K |
| 3BR145-230 sqm | AED 75K | AED 125K |
| 2-bedroom villa | — | AED 173K |
| 3-bedroom villa | — | AED 300K |
| 4-bedroom villa | — | AED 475K |
| 5-bedroom villa | — | AED 773K |
| 6-bedroom villa | — | AED 900K |
Median annual rent of registered Ejari leases, 2025-11-10 to 2026-11-02. Ejari does not record bedrooms for apartments, so rents are grouped by floor area; the bedroom type shown is the usual one at that size.
Median Sale Price by Year
Median price of all sales registered with the Dubai Land Department each year. Years with fewer than 20 sales are left out.
Lifestyle & Commute
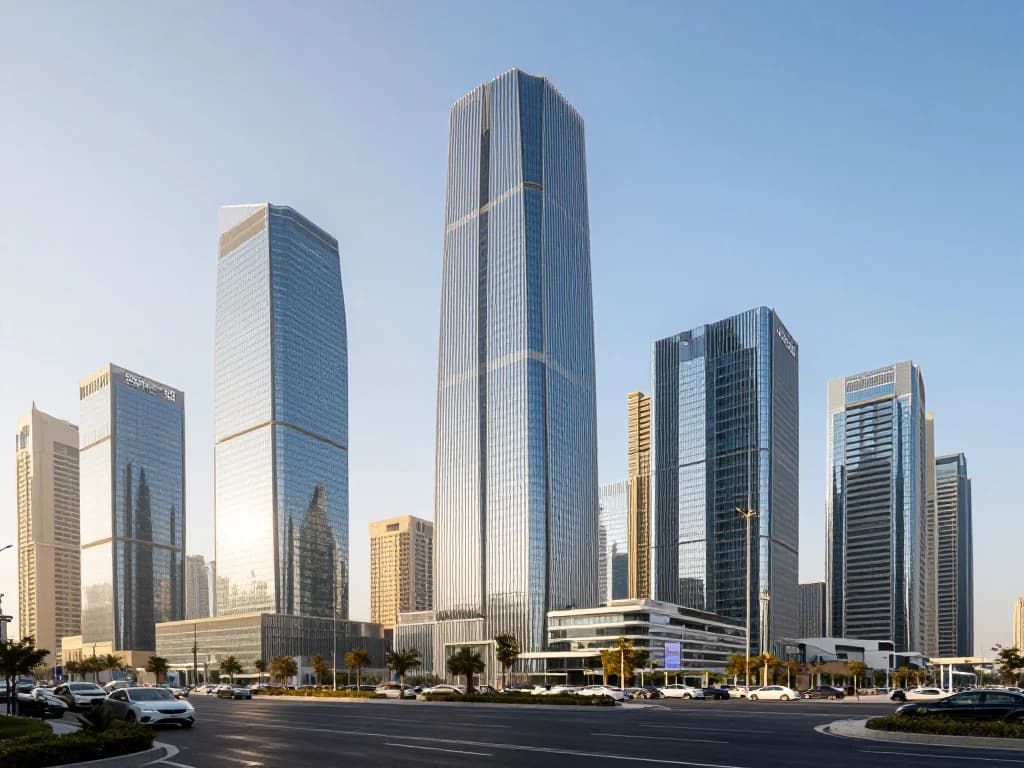
Dubai Investment Park Second

Dubai Production City
Metro: No metro station within 3 km
Explore These Areas
Dubai Investment Park Second
Not finding the right place?
Tell verified agents what you need. Up to 5 send you matching homes, and your number stays private until you choose.
Post a requestFrequently Asked Questions
Which is better to live in: Dubai Investment Park Second or Dubai Production City?
Which is cheaper: Dubai Investment Park Second or Dubai Production City?
Which has better property prices: Dubai Investment Park Second or Dubai Production City?
Which has better rental yields: Dubai Investment Park Second or Dubai Production City?
Related Comparisons
Dubai Investment Park Second vs Remraam
Compare with Remraam
Compare →
Dubai Production City vs Jumeirah Village Triangle
Compare with Jumeirah Village Triangle
Compare →
Dubai Investment Park Second vs Dubai Investment Park 1
Compare with Dubai Investment Park 1
Compare →
Dubai Production City vs Sports City
Compare with Sports City
Compare →
Dubai Production City vs Jumeirah Village Circle
Compare with Jumeirah Village Circle
Compare →
Dubai Investment Park Second vs Damac Hills
Compare with Damac Hills
Compare →
Data Methodology
Rental Yield: Gross yield = median annual rent of registered leases ÷ median price of ready (not off-plan) sales of the same kind of home, both from Dubai Land Department data. Shown for Dubai areas only.
Average Rent: Median annual rent of registered Ejari residential leases for 50–90 m² flats (the typical 1-bedroom size). Shown for Dubai areas only.
Transaction Data: Sourced from Dubai Land Department. Transaction counts may be zero for areas with limited direct reporting, even where rental activity exists.
Anomaly Flagging: Values marked ⚠ are statistically unusual for the area and may reflect premium property mixes, data aggregation errors, or limited sample sizes.
Disclaimer: This comparison is for informational purposes only and does not constitute financial, legal, or investment advice. Property prices, rents, and yields are based on 2026 market data and may vary. Always consult a licensed real estate advisor before making investment decisions.