About the Area Barsha Heights
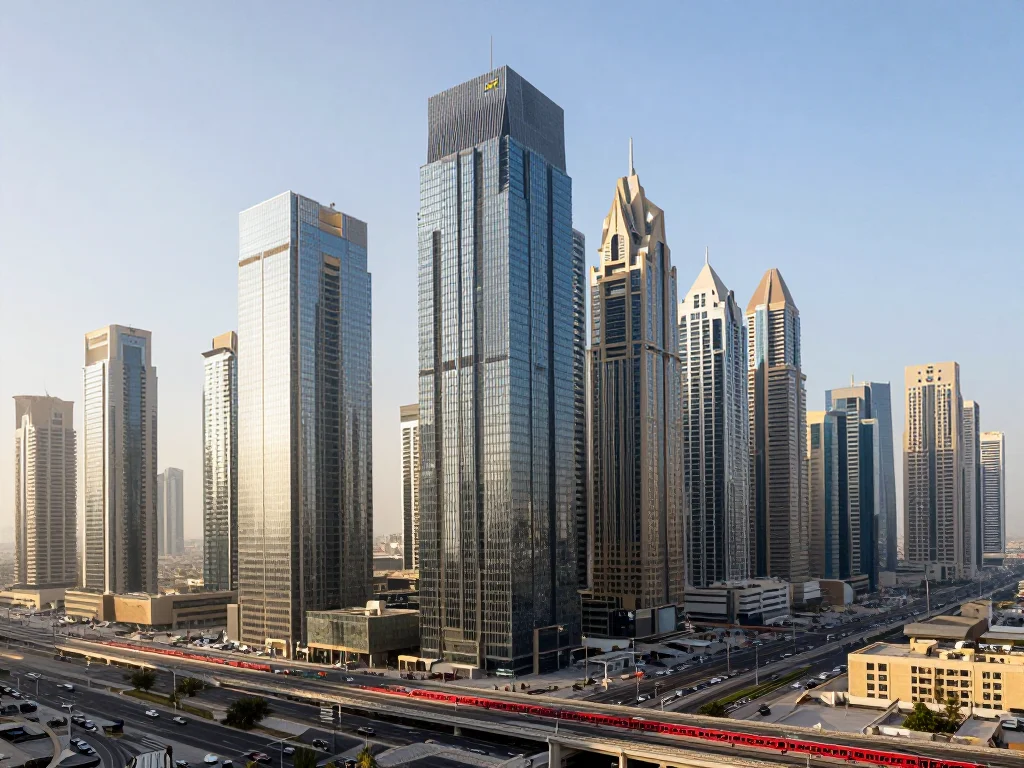
Barsha Heights, formerly known as TECOM, is a vibrant, mixed-use urban community located in the heart of "New Dubai." Positioned right along Sheikh Zayed Road, this neighborhood serves as a strategic bridge between the city’s major residential and commercial hubs. It is characterized by its high-density skyline of modern towers that house residential apartments, sleek offices, and upscale hotels. Historically established to support the nearby media and technology free zones, it has evolved into a self-sustained district where residents can live, work, and play. The area is renowned for its cosmopolitan energy, attracting a global population of professionals. With its blend of affordability and central positioning, Barsha Heights remains one of Dubai’s most desirable locations for those who want to be at the center of the action.
Community Overview Barsha Heights
The community of Barsha Heights is a melting pot of cultures, offering a fast-paced urban lifestyle that appeals specifically to young professionals and small families. Unlike quiet suburban sectors, life here is active 24/7. The streets are pedestrian-friendly, with wide walkways lined with cafes, pharmacies, and convenience stores. The atmosphere is energetic during the workday due to the corporate offices, transitioning into a lively social scene in the evenings. Residents enjoy high convenience, as most daily necessities are within a short walk from any tower. It is also a pet-friendly community, often seen as a more affordable alternative to the neighboring Marina or Downtown. The diversity of residents creates a unique, inclusive vibe that makes newcomers feel immediately at home in this urban jungle.
Properties Overview Barsha Heights
The property landscape is dominated by high-rise towers, offering versatile options for investors and renters. Residential units range from compact studios to expansive three-bedroom apartments. Many buildings offer excellent value, featuring larger square footage compared to newer developments. Investors are drawn to Barsha Heights due to its consistently high rental yields, typically between 6% and 8%. The area also boasts a significant number of serviced hotel apartments, catering to business travelers. For companies, the commercial market offers flexible office spaces highly sought after due to the district's proximity to Dubai Media City and Internet City. Most towers come equipped with modern amenities, including rooftop pools, gyms, and designated basement parking for residents.
Lifestyle & Amenities Barsha Heights
Lifestyle in Barsha Heights is defined by variety. The dining scene features everything from high-end hotel restaurants like Toshi and The Belgian Beer Cafe to authentic street food and cozy coffee shops. While the area doesn't have a mega-mall, it is located less than 10 minutes away from the Mall of the Emirates and Dubai Marina Mall. For fitness enthusiasts, the area is a hub for specialized boutique gyms and martial arts centers. Leisure time can be spent at the nearby Jebel Ali Racecourse or enjoying the lush pathways of The Greens, perfect for evening strolls. The district’s nightlife is also a major draw, with several licensed lounges offering city views. It’s an ideal neighborhood for those who appreciate a work-hard, play-hard philosophy.
Transportation Barsha Heights
Barsha Heights is a commuter’s dream. It is directly served by the Dubai Internet City Metro Station (Red Line), making it incredibly accessible via public transport. Strategically located between Sheikh Zayed Road (E11) and Al Khail Road (E44), it offers multiple entry points via Hessa Street. RTA feeder buses (F31 and F35) regularly connect residential blocks to the metro and surrounding areas like The Greens and Al Barsha. Taxis are available in abundance at all hours.
Amenities Barsha Heights
The district is exceptionally well-serviced. While it houses local clinics like Aster and Clover Medical Centre, major facilities like the Saudi German Hospital are just minutes away. For families, prestigious schools such as the American School of Dubai and Dubai Heights Academy are in the immediate vicinity. Numerous nurseries, like Chubby Cheeks, are located within residential towers. The area features various mosques and a vast selection of supermarkets like Carrefour and West Zone.
Nearby Locations Barsha Heights
Dubai Marina: 10 minutes drive.
Palm Jumeirah: 10 minutes drive.
Mall of the Emirates: 8 minutes drive.
Dubai Media City: 5 minutes drive.
Downtown Dubai: 15-20 minutes drive.
The Greens: Directly adjacent.
Al Barsha: 5-10 minutes drive.
Things to Consider Barsha Heights
Residents should note that traffic congestion can be heavy during peak hours, particularly near Hessa Street. Visitor parking can also be challenging, as street parking fills up quickly. The high-density nature of the district means it lacks the quiet serenity of suburban life. However, for those seeking a vibrant, central, and walkable urban experience, these factors are minor trade-offs.
Schools in Barsha Heights
View all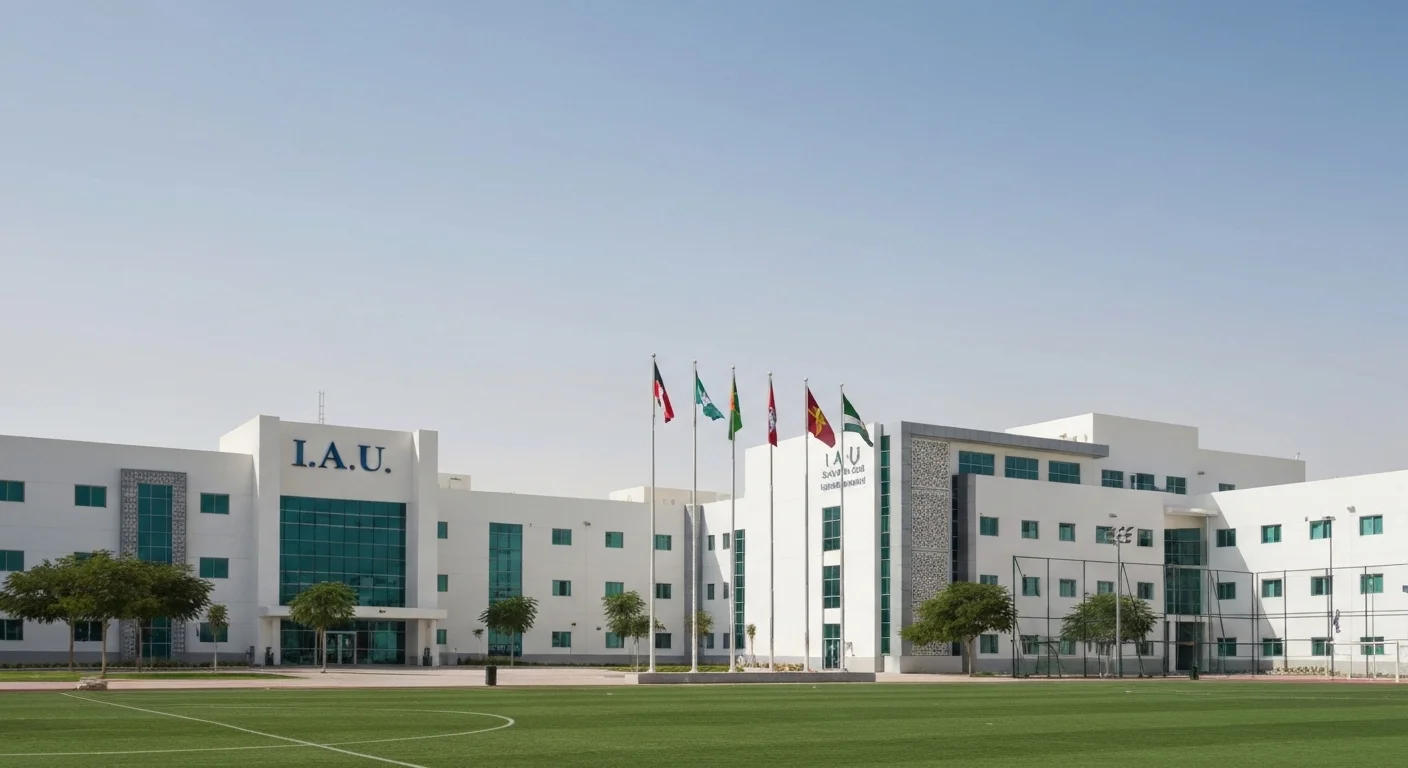
Buildings in Barsha Heights
View all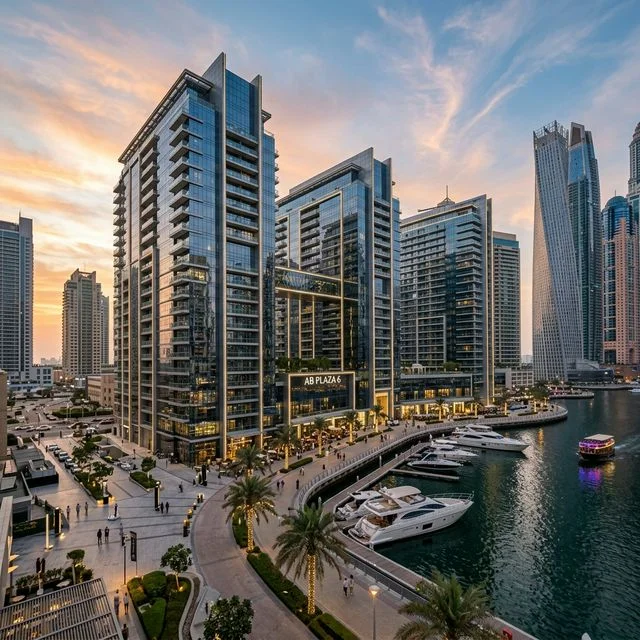
AB Plaza 6
residentialDewa
12F Both🐾 No Pets
Service Charge
AED 14.5/sqft
Al Alka 3
residentialDewa
20F Etisalat🐾 Cats Only
Service Charge
AED 15/sqft
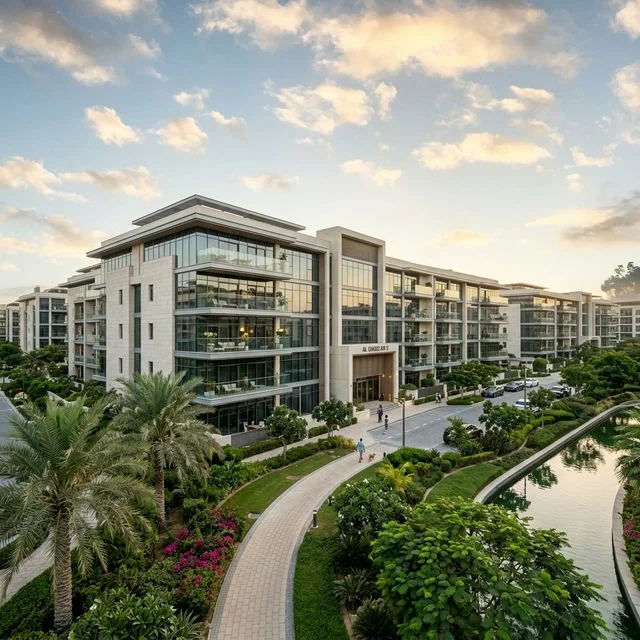
Al Arta 4
residentialDewa
20F Etisalat🐾 Cats Only
Service Charge
AED 15/sqft
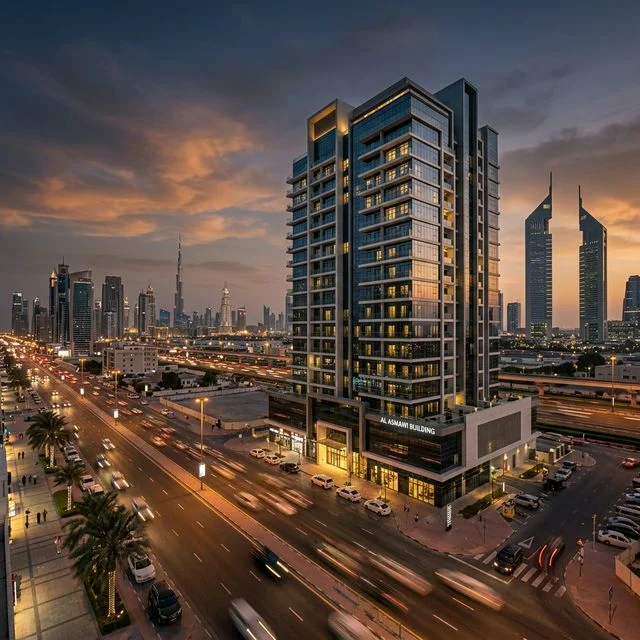
Al Asmawi Building
residentialDewa
12F Both🐾 No Pets
Service Charge
AED 14/sqft
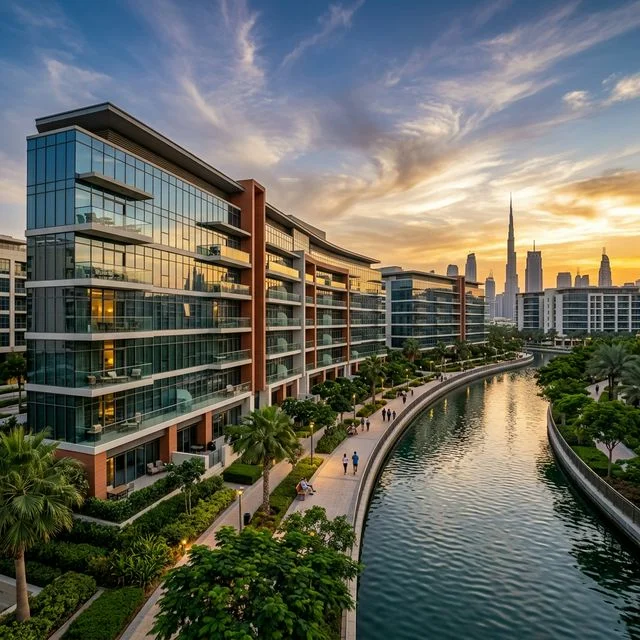
Al Ghozlan 1
residentialDewa
20F Etisalat🐾 Cats Only
Service Charge
AED 15/sqft
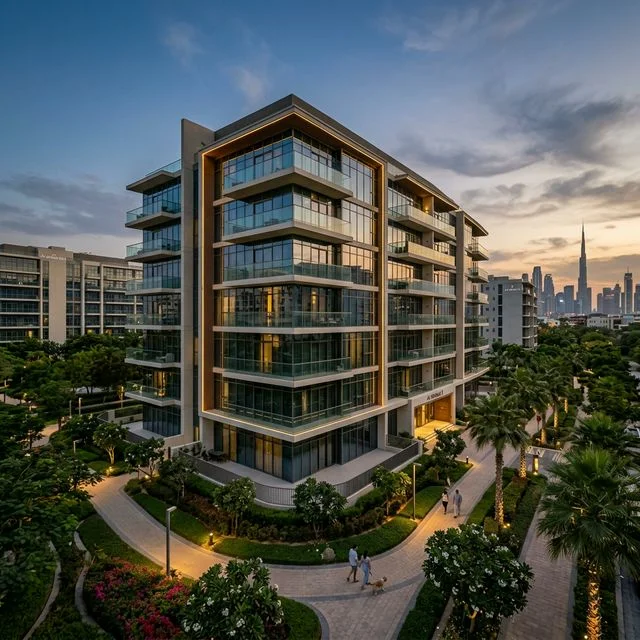
Al Ghozlan 3
residentialDewa
12F Both🐾 No Pets
Service Charge
AED 14/sqft
Frequently Asked Questions about Barsha Heights
Is Barsha Heights a good area to live in Dubai?
Yes, Barsha Heights is a popular residential and mixed-use community in Dubai, known for its central location, affordable apartments, and proximity to major business districts like Media City and Internet City.
What types of properties are available in Barsha Heights?
Barsha Heights mainly offers studio, one-bedroom, and two-bedroom apartments in high-rise buildings, along with serviced apartments and hotel residences suitable for residents and investors.
Is Barsha Heights suitable for families?
Barsha Heights can be suitable for small families and professionals due to nearby schools, clinics, supermarkets, and parks, though it is more popular among working professionals.
How is transportation in Barsha Heights?
Barsha Heights has good connectivity via Sheikh Zayed Road and Al Khail Road. The area is served by Dubai Internet City Metro Station and multiple bus routes, making commuting convenient.
What lifestyle and amenities does Barsha Heights offer?
Barsha Heights offers a vibrant lifestyle with restaurants, cafés, hotels, gyms, supermarkets, and retail outlets. The area is close to beaches, shopping malls, and leisure destinations.
Location Map
Community Guide
Live in
Barsha Heights?
Find your perfect home in Barsha Heights. Browse exclusive listings for sale and rent.
Market Research
Deep Dive into
Barsha Heights Data
View price trends, transaction volumes, rental yields, property type distribution, and interactive maps sourced from DLD and Ejari.
View Full Research ReportLatest Properties in Barsha Heights
View AllExplore Nearby Areas
Discover popular communities and neighborhoods within easy reach of Barsha Heights.
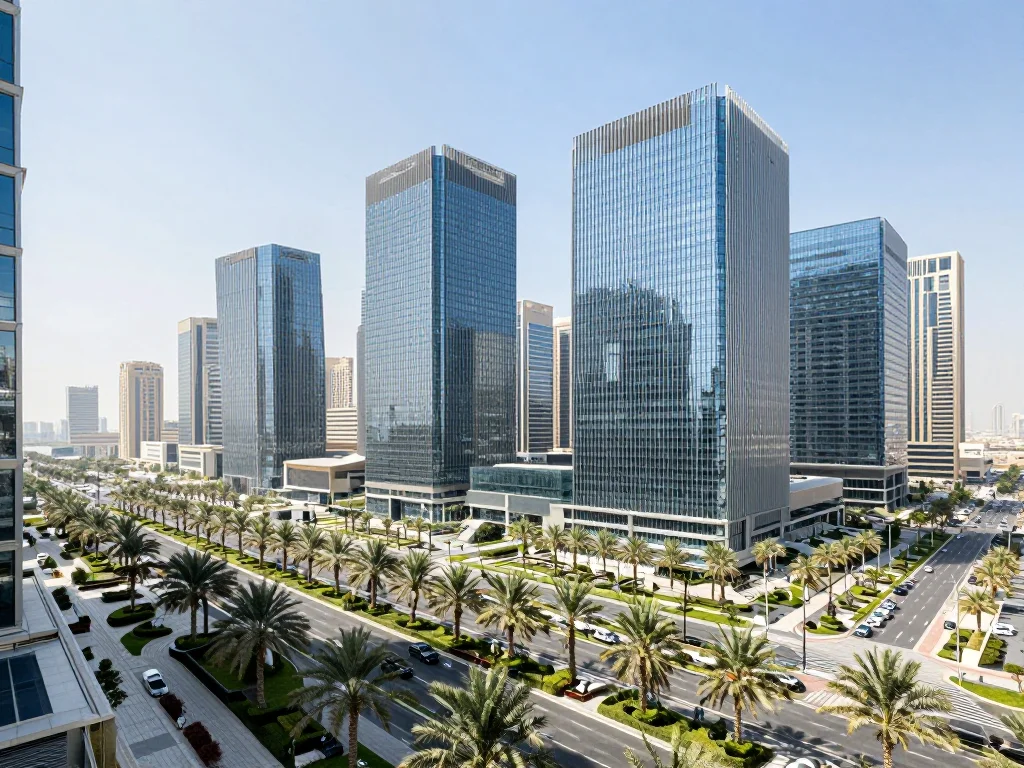
1.8 km
Dubai Internet City
Explore community guide
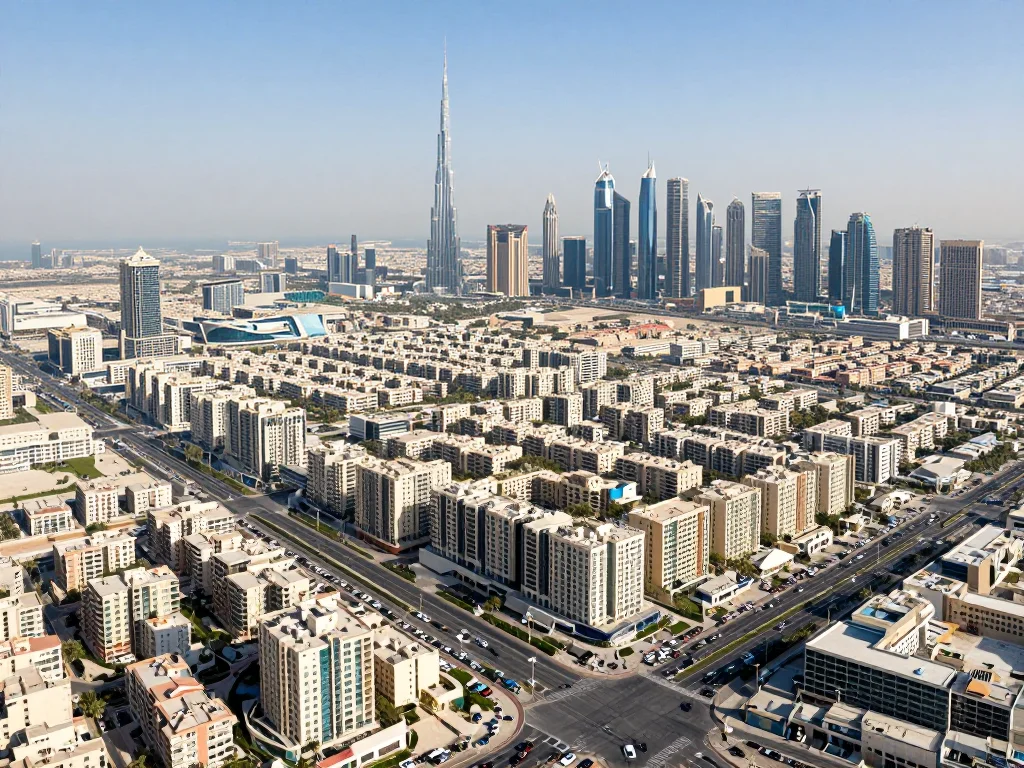
2.2 km
Al Barsha
Avg. Rent (1BR)AED 524,219
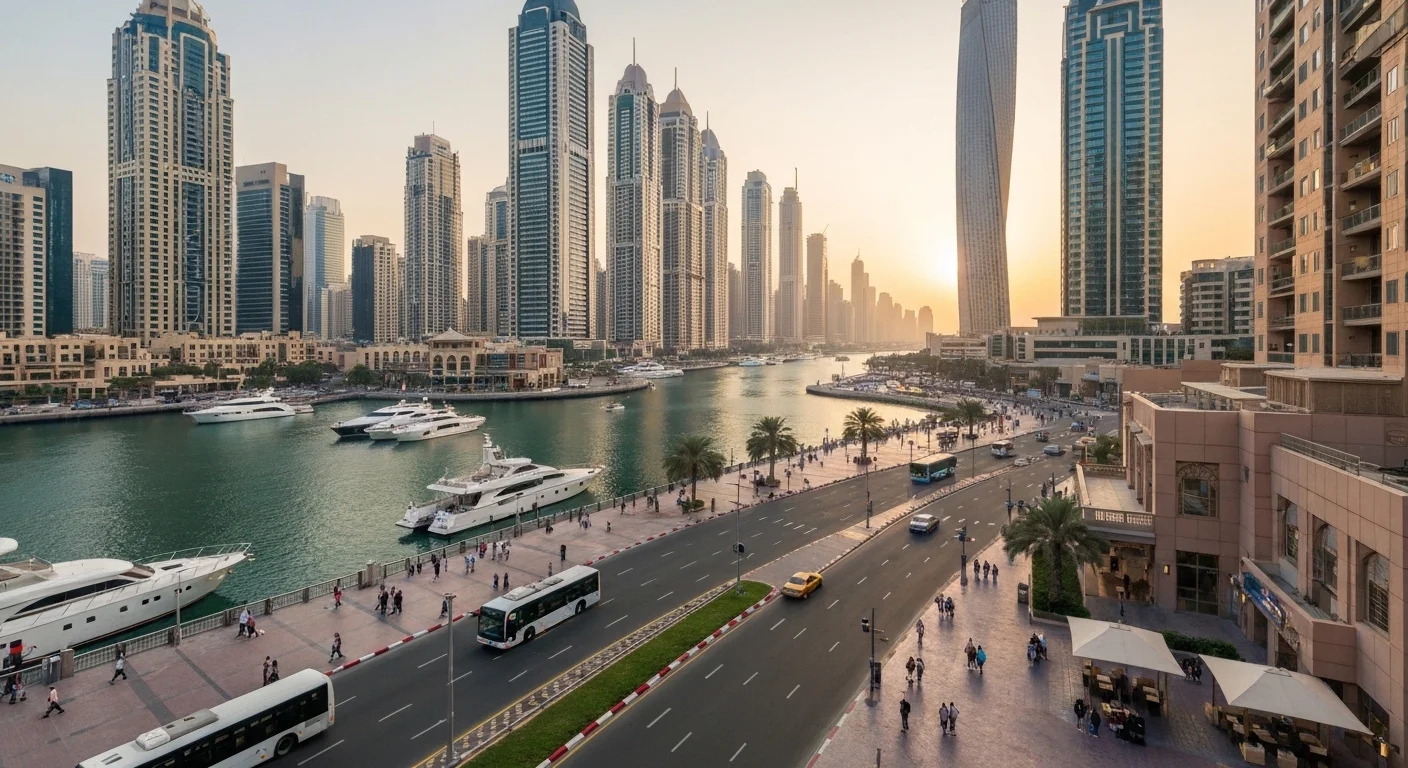
2.6 km
Dubai Marina
Avg. Rent (1BR)AED 120,000
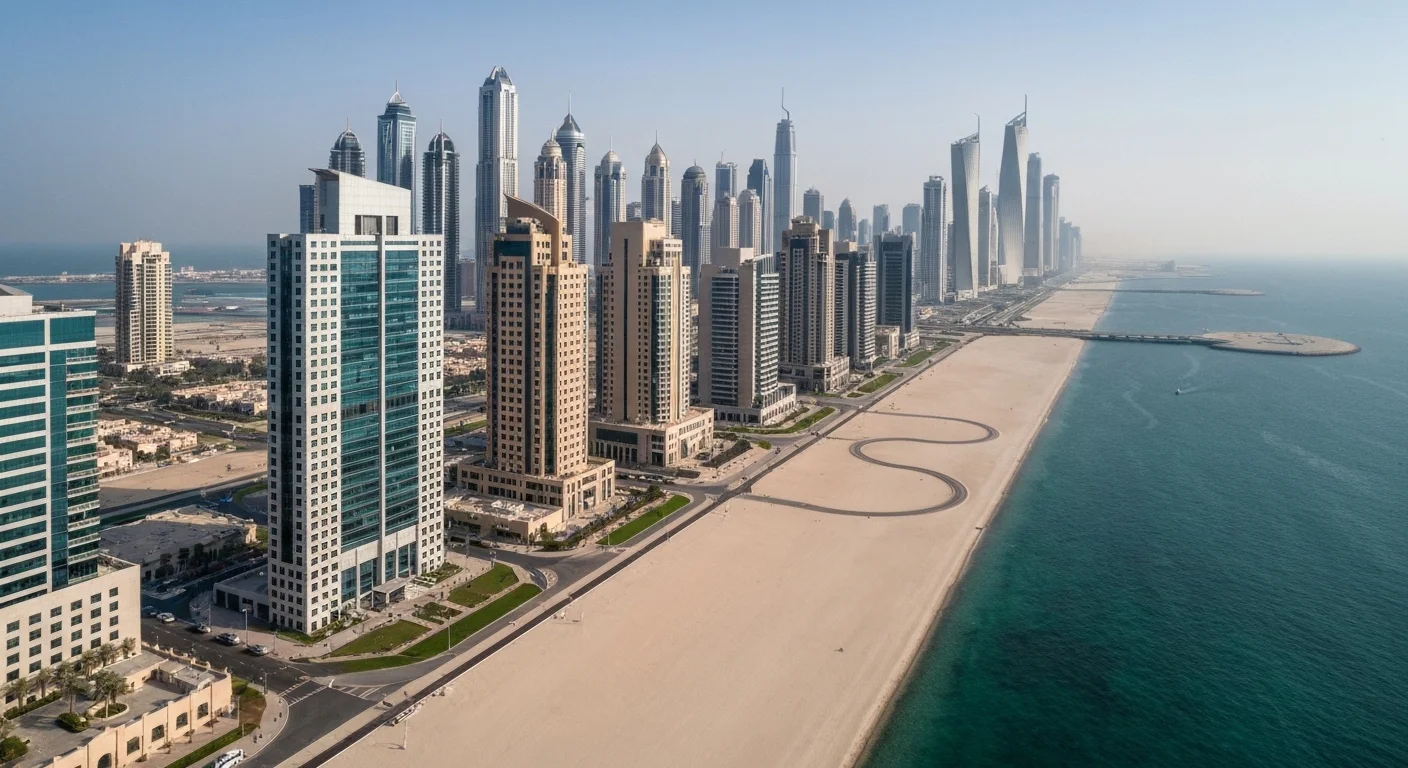
3.9 km
Dubai Media City
Avg. Rent (1BR)AED 80,000
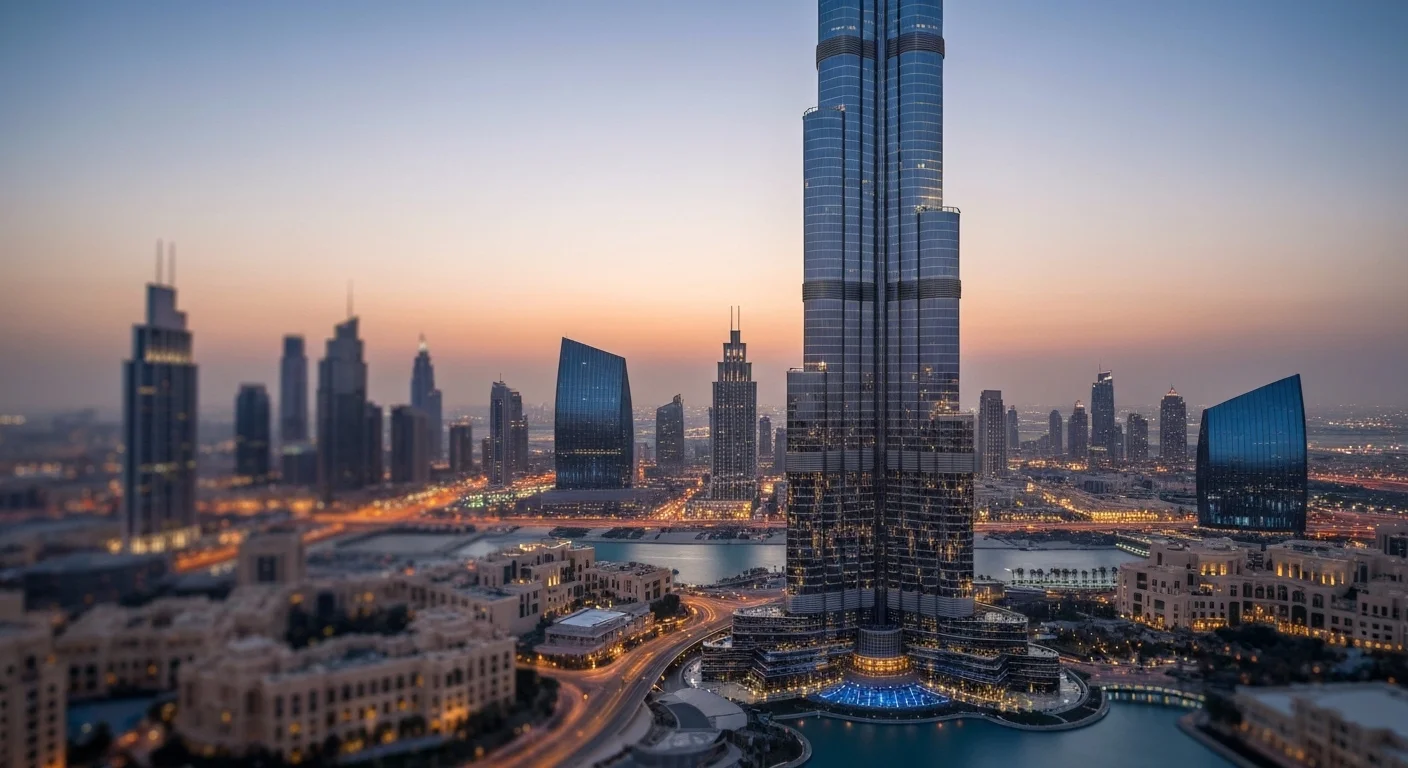
5.0 km
The Views
Avg. Rent (1BR)AED 80,000
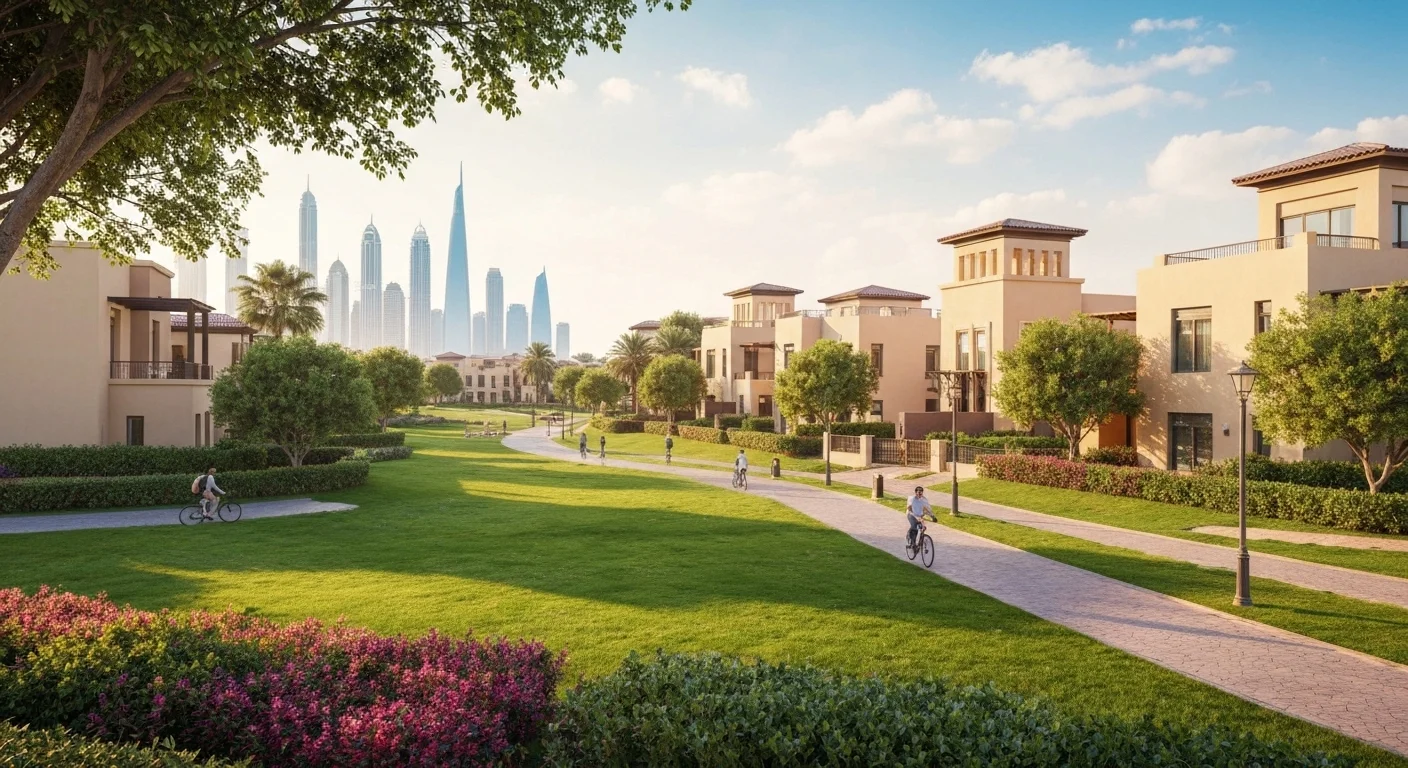
5.0 km
The Greens
Avg. Rent (1BR)AED 80,000
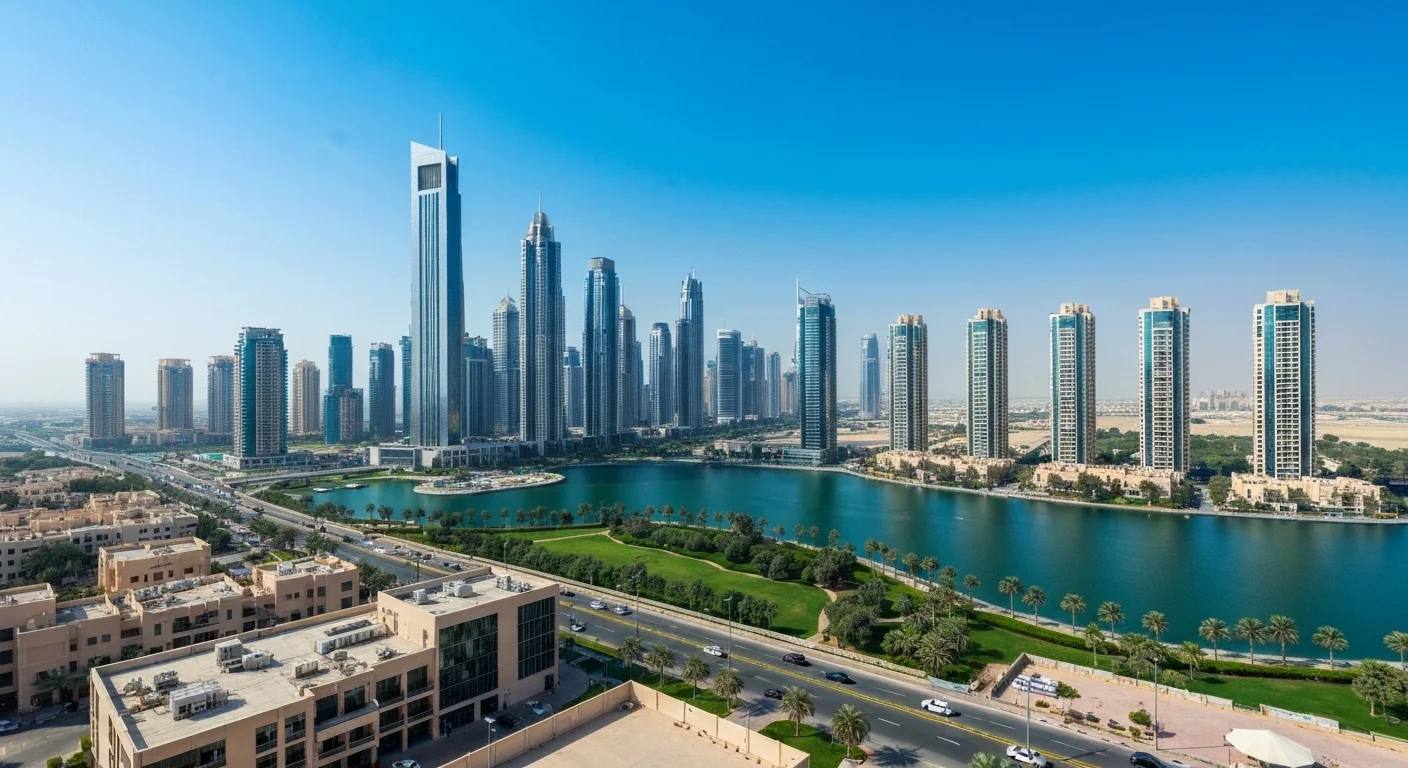
5.1 km
Jumeirah Lake Towers (JLT)
Avg. Rent (1BR)AED 90,000
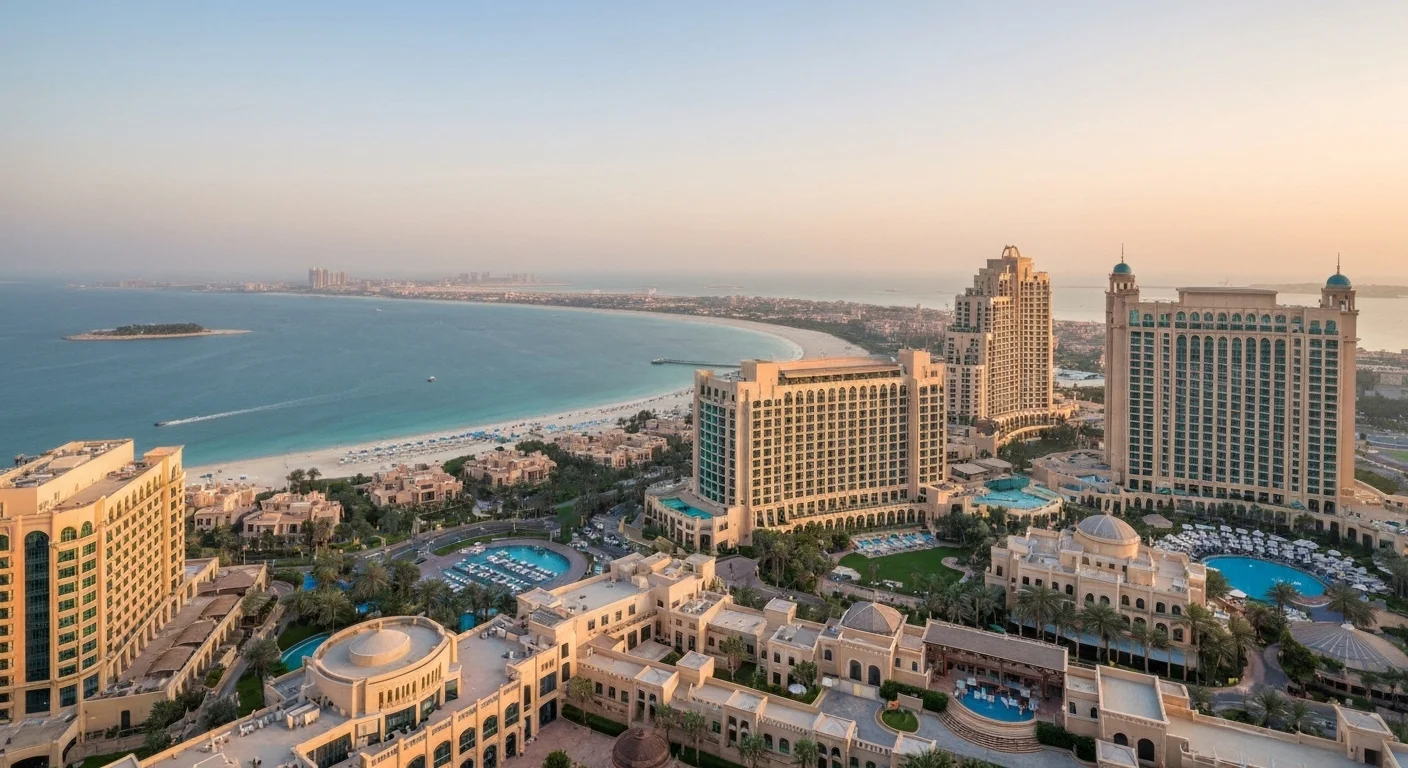
5.1 km
Jumeirah Beach Residence
Avg. Rent (1BR)AED 120,000
Explore More
Have a Property in Barsha Heights?
Post your listing and reach thousands of potential buyers and renters
Post Free AdCompare Barsha Heights
See how Barsha Heights stacks up against other Dubai neighborhoods
Al Barsha
vs Barsha Heights
Compare →
JLT
vs Barsha Heights
Compare →
Media City
vs Barsha Heights
Compare →
Disclaimer: Area information is provided for general guidance only and does not constitute professional property advice. Transaction data, rental yields, and market trends may change. Always verify current information directly with relevant authorities and professionals before making property decisions.
Updated N/A
Reviewed by Waqov Research Team