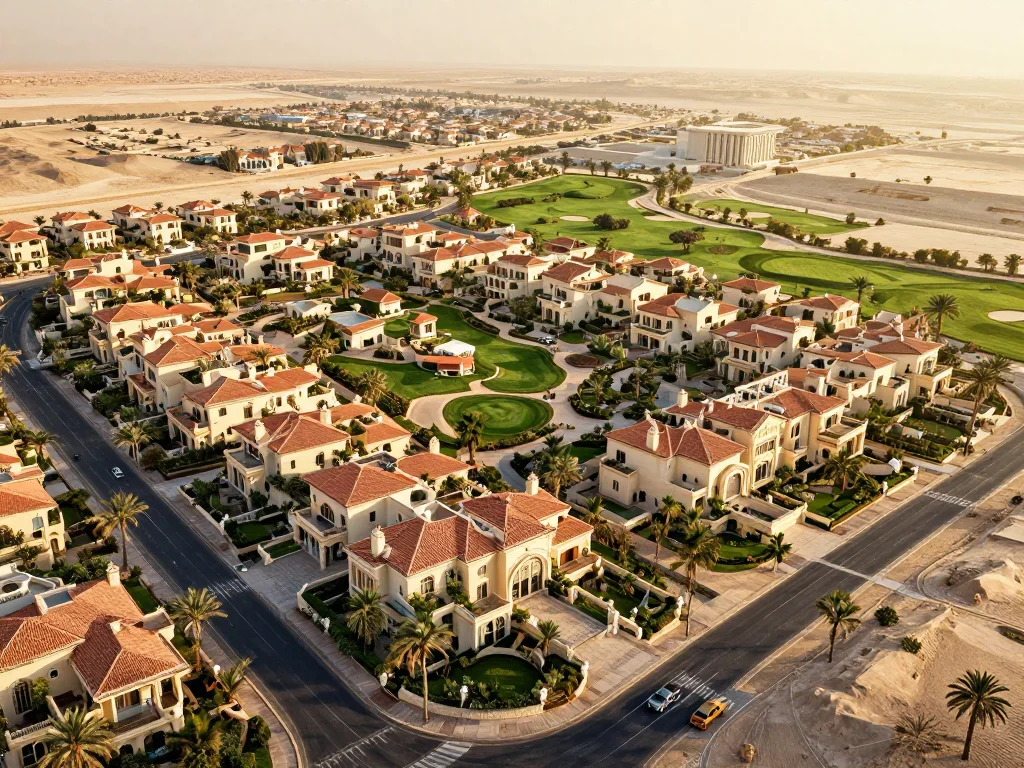
About the Area Arabian Ranches
Arabian Ranches, often referred to simply as "The Ranches," is a flagship master-planned community by Emaar. Spanning 1,650 acres of desert-themed landscape, it was one of the first freehold suburban neighborhoods in Dubai. It offers an escape from the city’s high-rise bustle, replacing skyscrapers with lush greenery, tranquil lakes, and Mediterranean and Arabic-styled villas. Since its launch, it has become the gold standard for luxury family living, blending high-end residential comfort with an active outdoor lifestyle. The community is built around the prestigious Arabian Ranches Golf Club, providing a scenic backdrop of rolling fairways. Whether you are looking for a serene environment to raise a family or a premium investment in a mature market, Arabian Ranches remains one of the most respected and high-value addresses in the Middle East.
Community Overview Arabian Ranches
The community of Arabian Ranches is defined by its sense of togetherness and exclusivity. It is home to a diverse mix of affluent expatriates and local families who value privacy and a high quality of life. The district is meticulously divided into distinct sub-communities like Saheel, Savannah, Mirador, and Al Mahra, each offering a unique architectural flavor. The neighborhood is highly walkable, with pedestrian-friendly paths connecting residential clusters to community centers and parks. It is a place where neighbors meet at the golf club for dinner or jog along the scenic trails during sunset. The community’s spirit is bolstered by seasonal events and a shared appreciation for nature and sports, making it more than just a place to live, but a thriving, self-contained lifestyle destination.
Properties Overview Arabian Ranches
Real estate in Arabian Ranches exclusively features standalone villas and townhouses, catering to those who demand space and luxury.
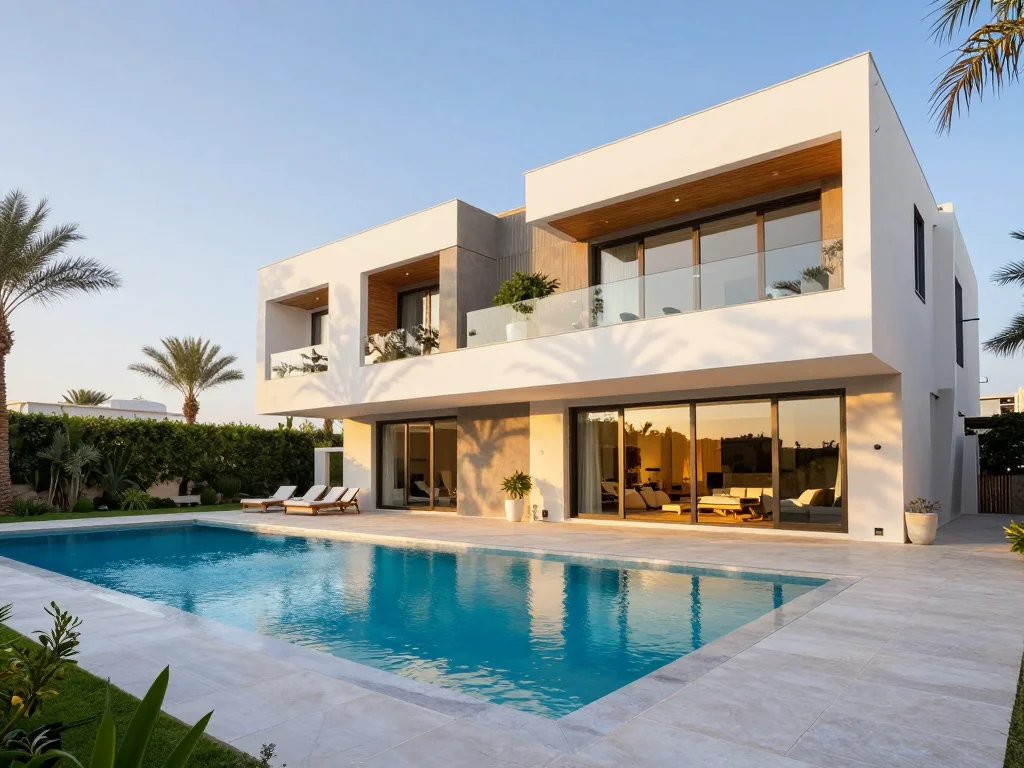
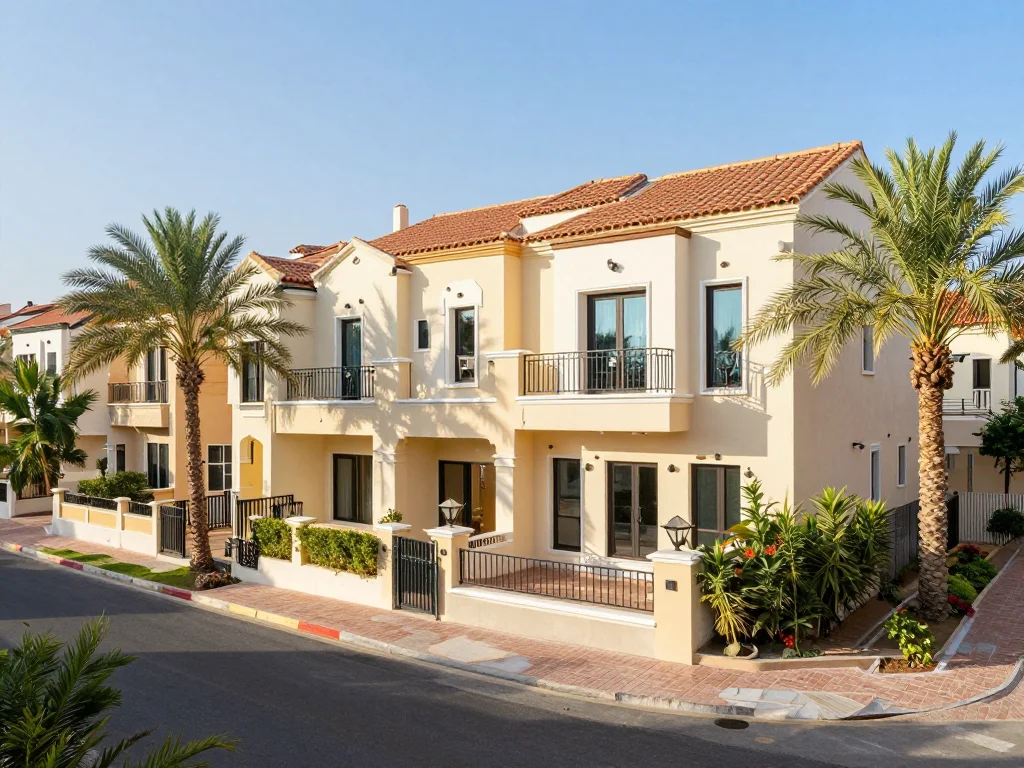
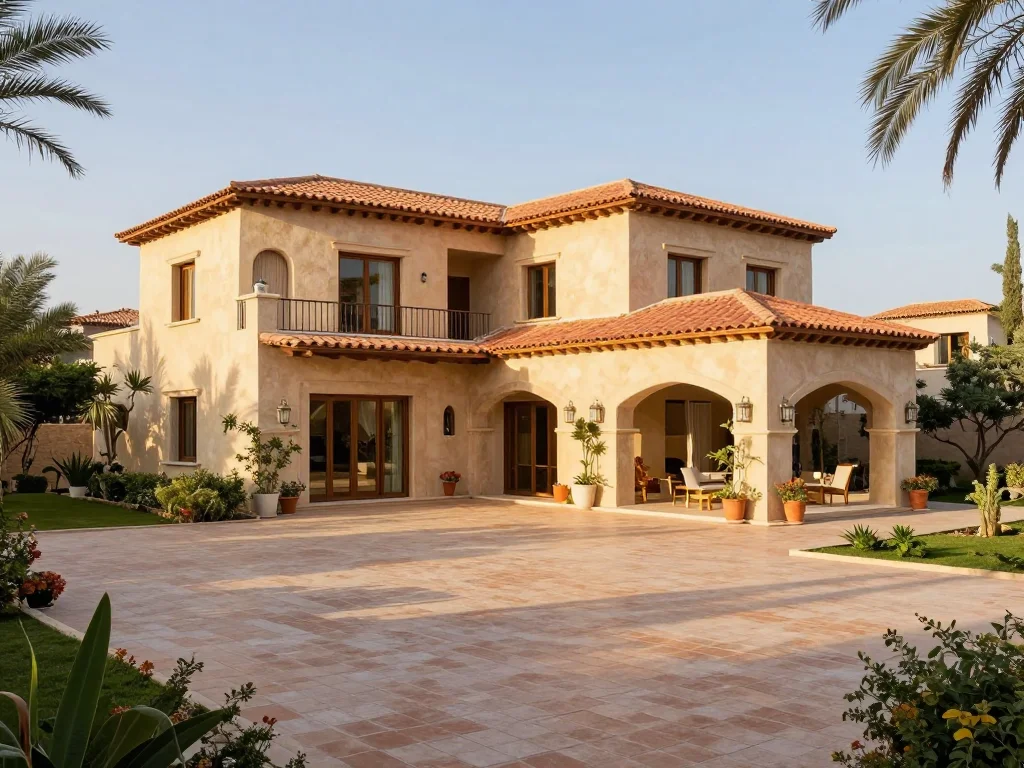
Villa Styles: Homes range from 2-bedroom townhouses to massive 7-bedroom luxury mansions. Design inspirations include Spanish Coastal, Arabic, and Contemporary styles.
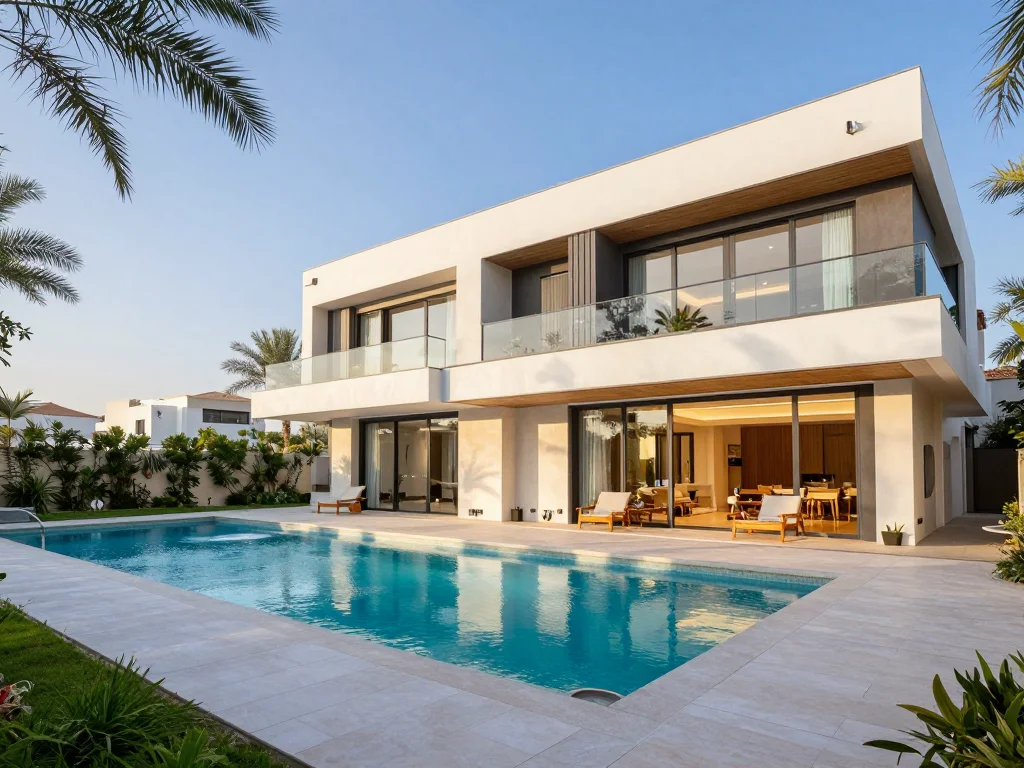
Luxury Features: Most properties boast private gardens, and larger villas often include private swimming pools and views of the golf course.
Mature Market: As a fully established community, the landscaping is mature, and the infrastructure is flawless.
Investment ROI: Arabian Ranches is a top-tier investment choice. It offers steady capital appreciation and rental yields typically ranging from 5.5% to 6.5%, driven by the high demand for premium family housing in a secure, gated environment.
Lifestyle & Amenities Arabian Ranches
The lifestyle in "The Ranches" is focused on leisure and sophistication. The Arabian Ranches Retail Centre is the local hub, featuring a large Carrefour, pharmacies, salons, and a range of cafes and restaurants like Shakespeare and Co. For sport enthusiasts, the Arabian Ranches Golf Club offers an 18-hole championship course and a clubhouse with terrace dining. The nearby Dubai Polo & Equestrian Club adds a touch of class, offering polo matches and riding lessons. Outdoor life is vibrant, with miles of cycling and walking trails that meander through the desert landscape. It is a quiet, upscale lifestyle where the focus is on wellness, family time, and enjoying the great outdoors in a secure environment.
Transportation Arabian Ranches
Connectivity is seamless for car owners, with the community located right off Sheikh Mohammed Bin Zayed Road (E311) and Al Qudra Road (D63). This provides rapid access to key business hubs. While the area is not directly on the Metro line, RTA feeder buses connect the Ranches to the Mall of the Emirates Metro Station. The community’s internal layout is designed for safety, with low speed limits and ample visitor parking in retail areas.
Amenities Arabian Ranches
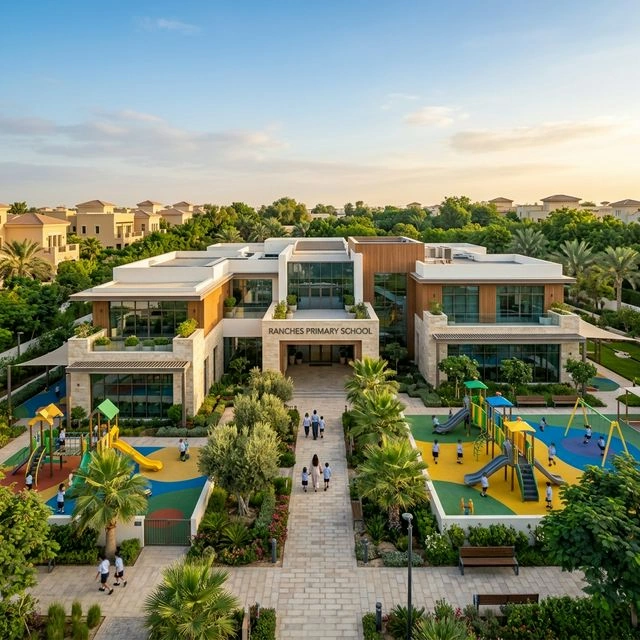
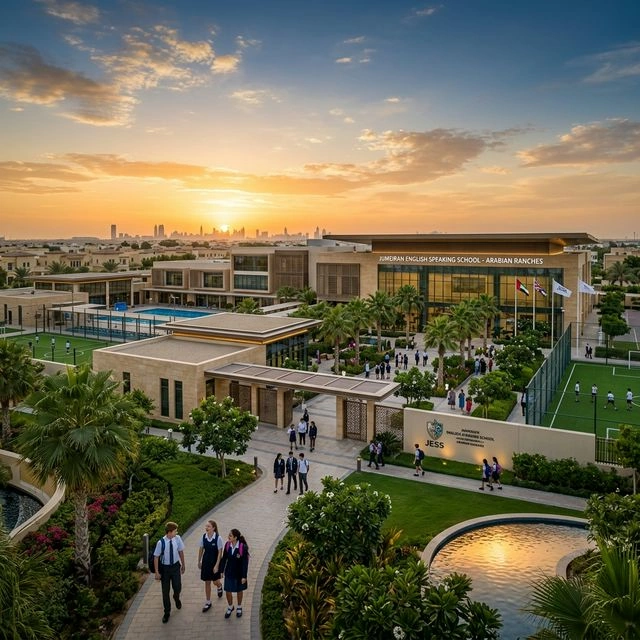
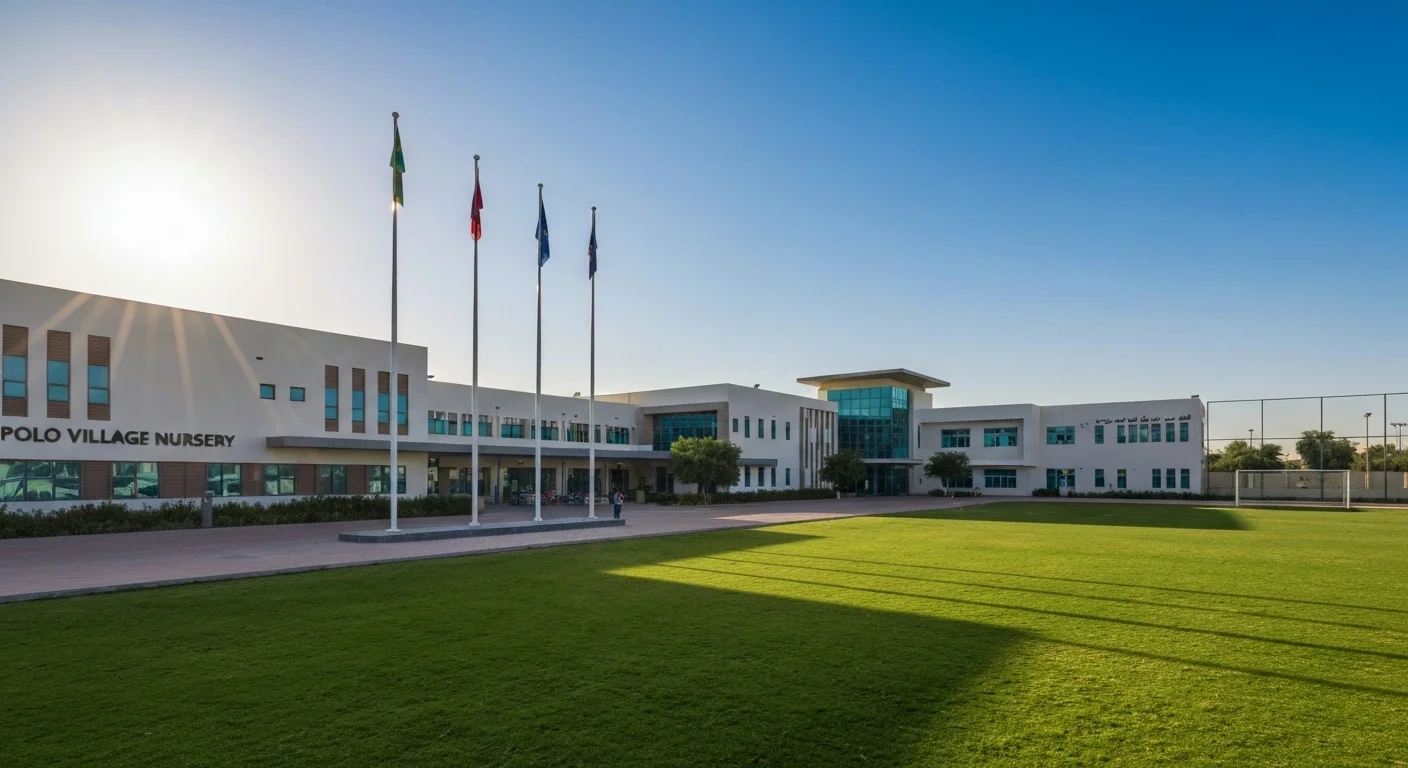
Arabian Ranches is world-renowned for its educational facilities, most notably Jumeirah English Speaking School (JESS), one of Dubai’s top-rated schools. For healthcare, the Mediclinic Arabian Ranches provides specialized care. The community features several beautiful mosques, including the Al Rahman Mosque. Residents also enjoy access to tennis courts, swimming pools, and extensive children’s play areas in every sub-community.
Nearby Locations Arabian Ranches
Global Village: 5-7 minutes drive.
Dubai Miracle Garden: 10 minutes drive.
Motor City & Sports City: 5-10 minutes drive.
Dubai Marina: 20 minutes drive.
Downtown Dubai / Burj Khalifa: 20-25 minutes drive.
Dubai International Airport (DXB): 25-30 minutes drive.
Al Maktoum International Airport (DWC): 25 minutes drive.
Things to Consider Arabian Ranches
Arabian Ranches is a car-dependent community; while public transport exists, having a vehicle is essential for convenience. During peak school hours, traffic around the main entrances can be slow. Additionally, as a mature community, some of the older villas may require renovation or modernization to meet the latest interior design trends, which should be factored into the purchase price.
Schools in Arabian Ranches
View all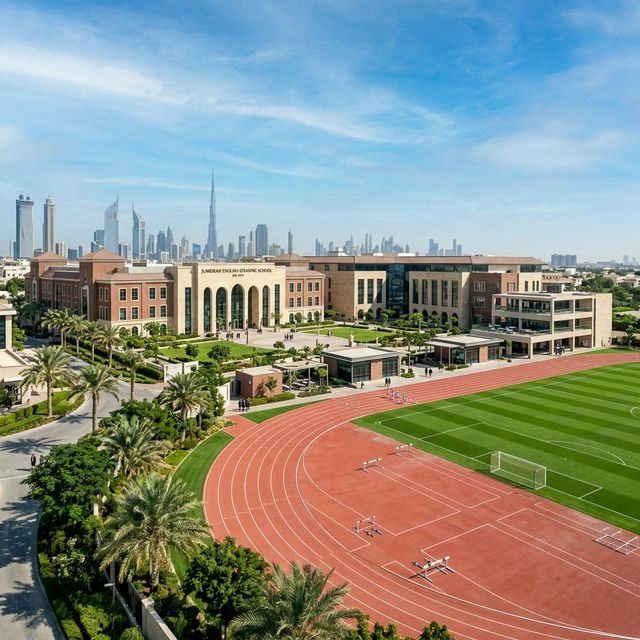
Buildings in Arabian Ranches
View all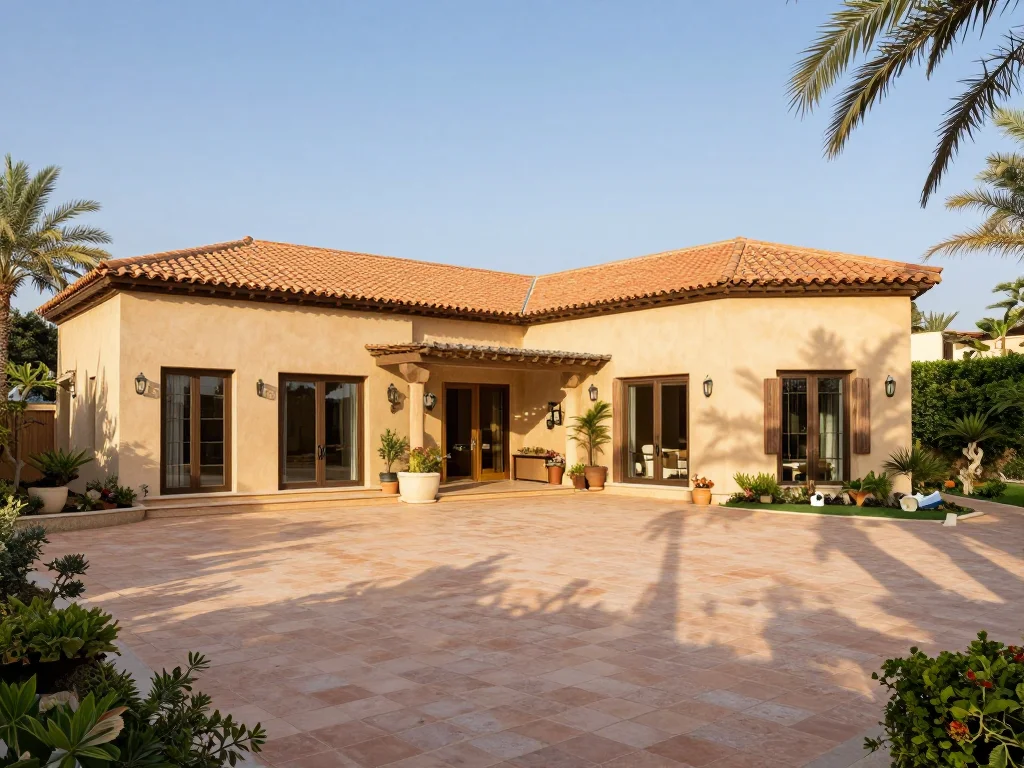
Abbey Crescent 1
residentialDewa
20F Etisalat🐾 Cats Only
Service Charge
AED 15/sqft
Easton Court
residentialDewa
20F Etisalat🐾 Cats Only
Service Charge
AED 15/sqft
New Bridge Hills 2
residentialDewa
20F Etisalat🐾 Cats Only
Service Charge
AED 15/sqft
New Bridge Hills 3
residentialDewa
20F Etisalat🐾 Cats Only
Service Charge
AED 15/sqft
Norton Court 1
residentialDewa
20F Du🐾 Cats Only
Service Charge
AED 15/sqft
Norton Court 2
residentialDistrict Cooling
6F Du🐾 No Pets
Service Charge
AED 12/sqft
Frequently Asked Questions about Arabian Ranches
Is Arabian Ranches a good area to live in Dubai?
Yes, Arabian Ranches is one of Dubai’s most prestigious residential communities, known for its peaceful environment, spacious villas, landscaped surroundings, and high-quality family living.
What types of properties are available in Arabian Ranches?
Arabian Ranches mainly offers villas and townhouses in various architectural styles, ranging from Spanish and Arabic to contemporary designs. Apartments are very limited in the community.
Is Arabian Ranches suitable for families?
Yes, Arabian Ranches is highly suitable for families. The community features schools, nurseries, parks, walking trails, golf courses, and a safe, gated environment.
How is transportation in Arabian Ranches?
Arabian Ranches is primarily car-dependent, with easy access to Sheikh Mohammed Bin Zayed Road and Emirates Road. Public transport options are limited, so private vehicles are recommended.
What amenities are available in Arabian Ranches?
The community offers excellent amenities including retail centers, supermarkets, schools, healthcare facilities, golf clubs, community parks, and recreational areas.
Location Map
Community Guide
Live in
Arabian Ranches?
Find your perfect home in Arabian Ranches. Browse exclusive listings for sale and rent.
Market Research
Deep Dive into
Arabian Ranches Data
View price trends, transaction volumes, rental yields, property type distribution, and interactive maps sourced from DLD and Ejari.
View Full Research ReportLatest Properties in Arabian Ranches
View AllExplore Nearby Areas
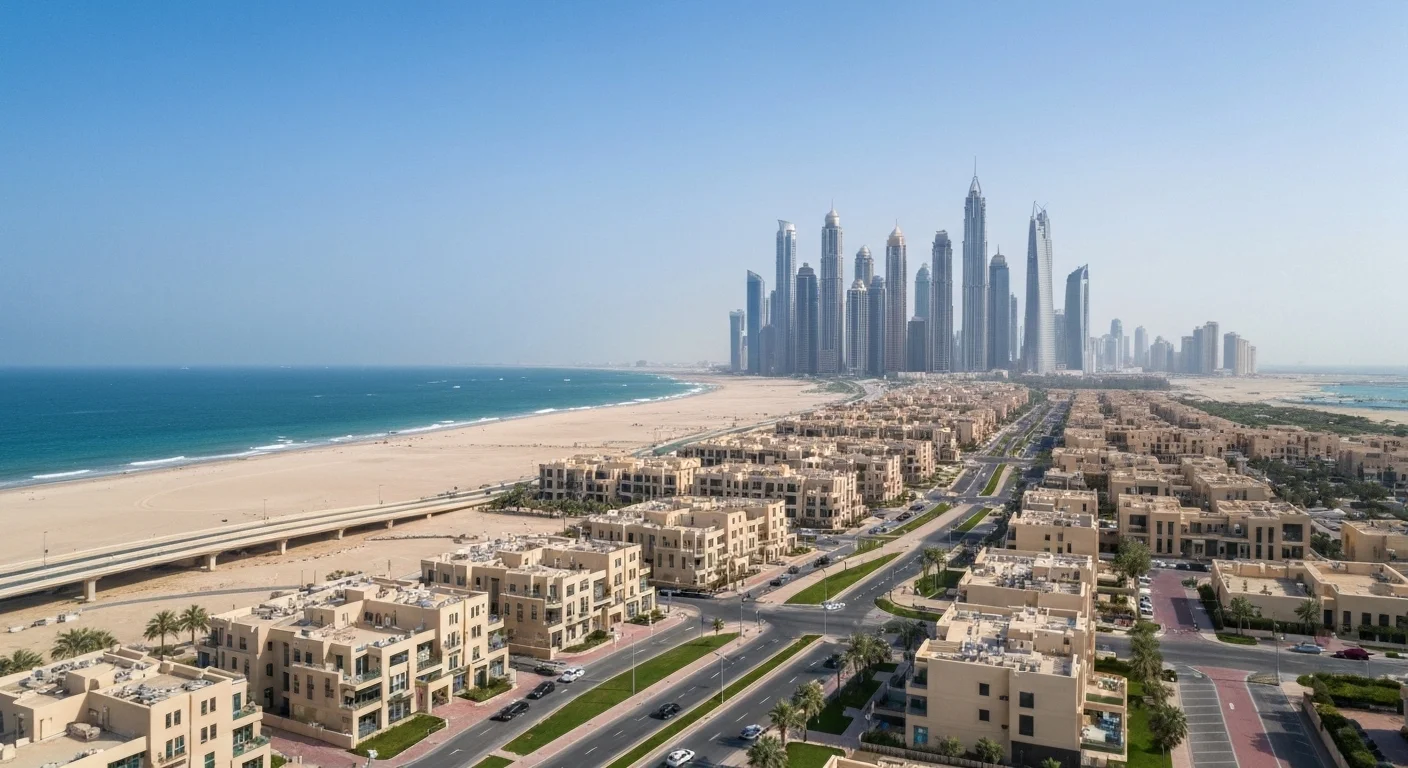
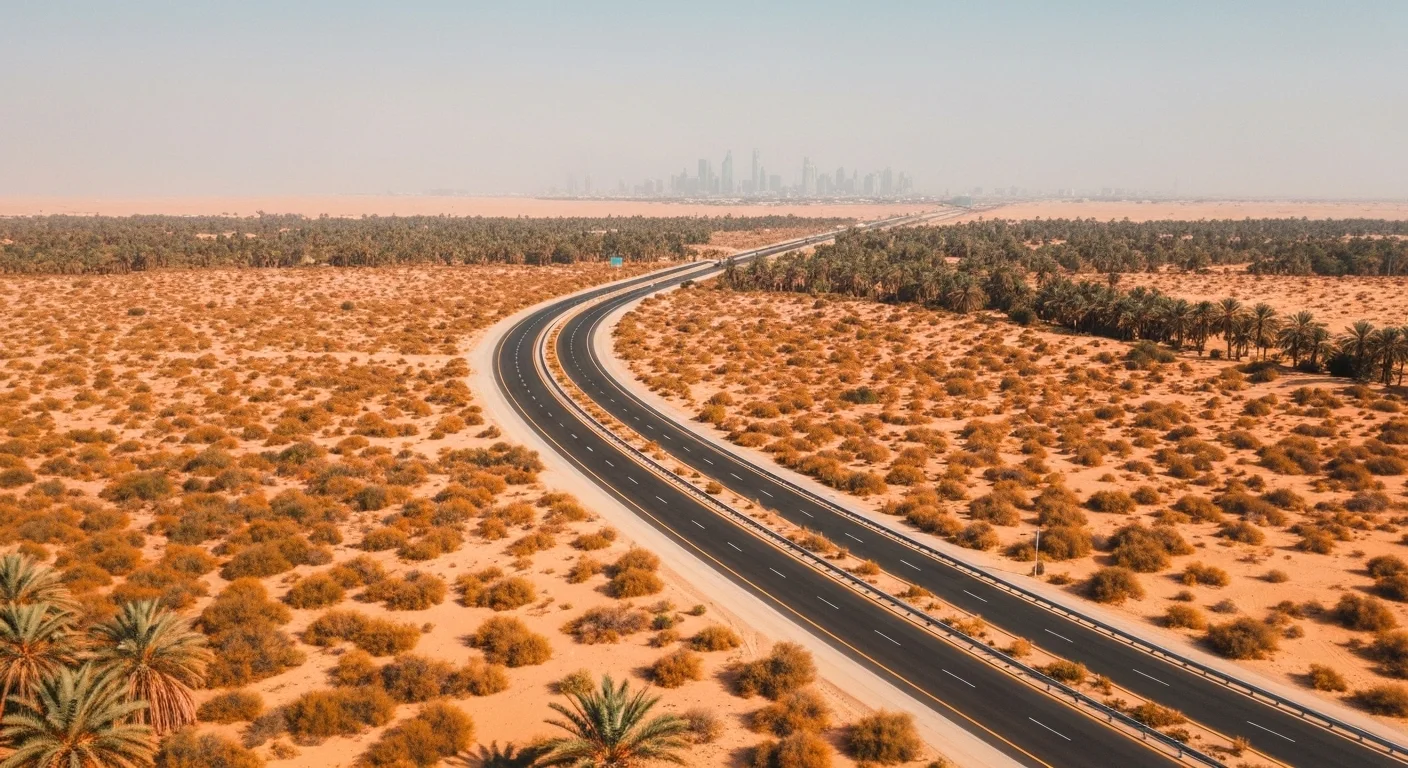
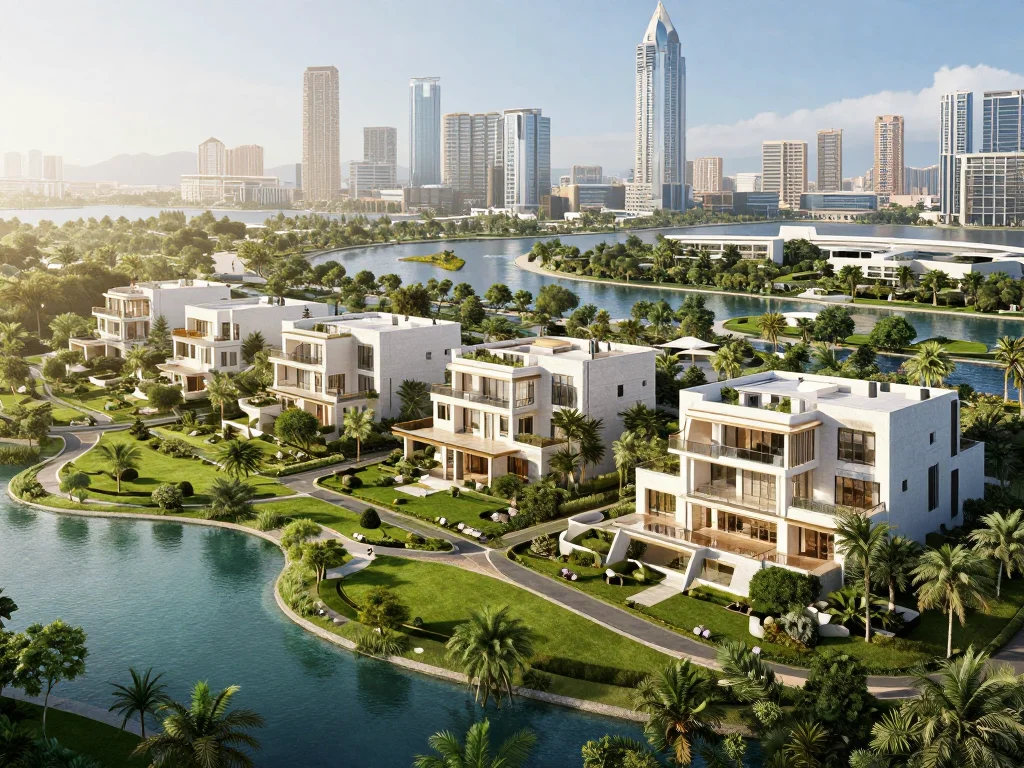
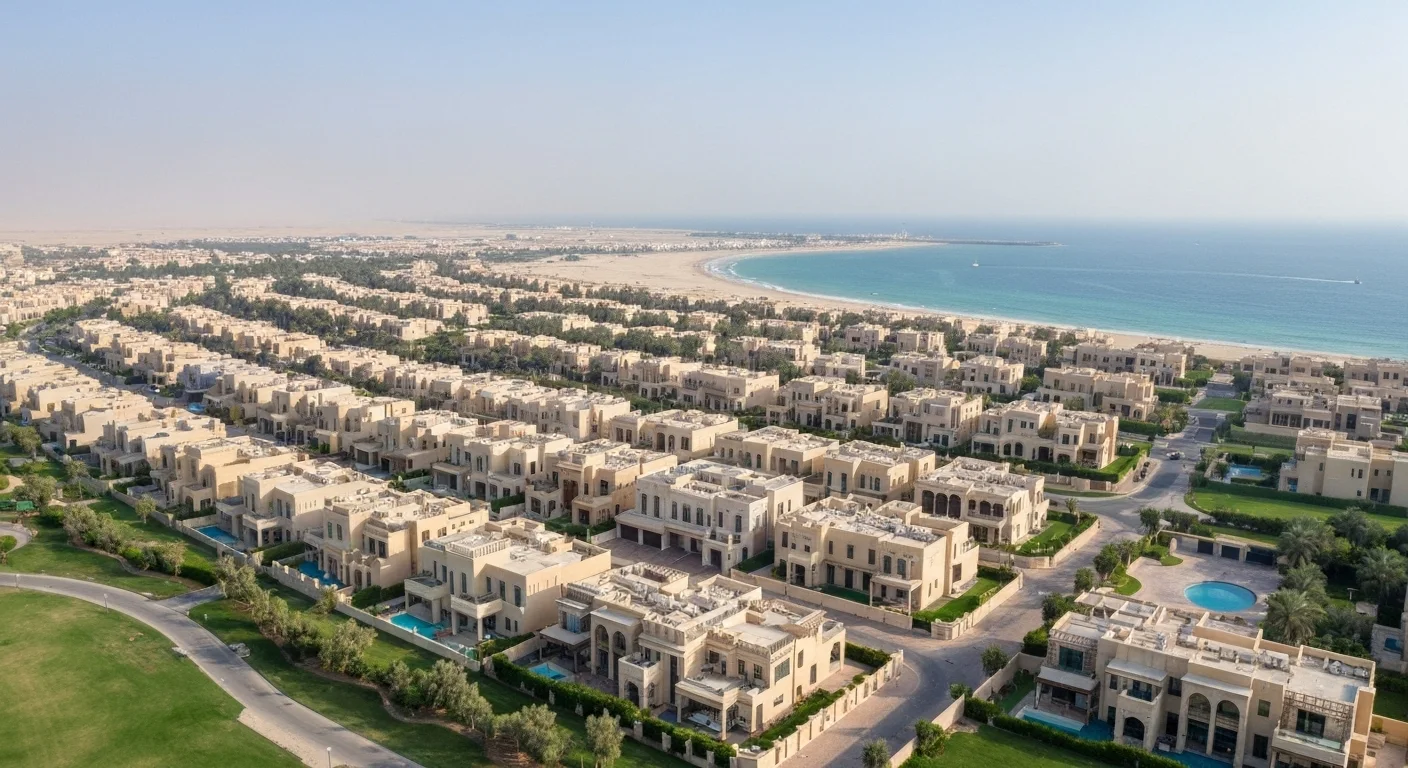
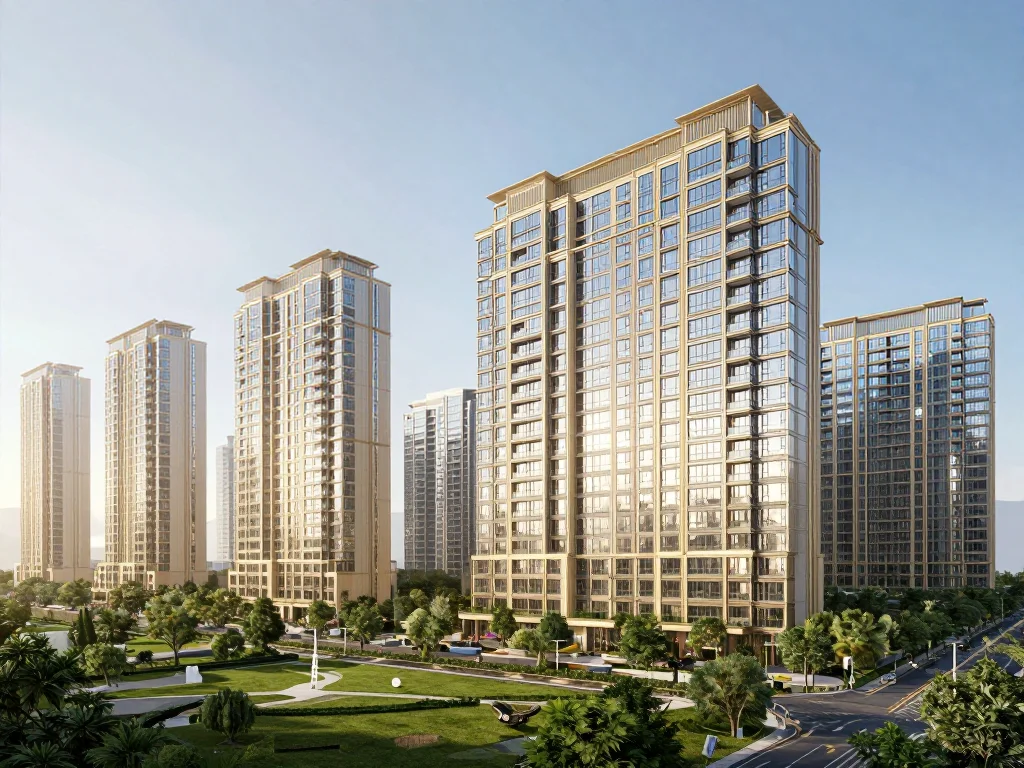
Discover popular communities and neighborhoods within easy reach of Arabian Ranches.
Explore More
Have a Property in Arabian Ranches?
Post your listing and reach thousands of potential buyers and renters
Post Free AdCompare Arabian Ranches
See how Arabian Ranches stacks up against other Dubai neighborhoods
Dubai Hills
vs Arabian Ranches
Compare →
Damac Hills
vs Arabian Ranches
Compare →
Motor City
vs Arabian Ranches
Compare →
Sports City
vs Arabian Ranches
Compare →
Disclaimer: Area information is provided for general guidance only and does not constitute professional property advice. Transaction data, rental yields, and market trends may change. Always verify current information directly with relevant authorities and professionals before making property decisions.
Updated N/A
Reviewed by Waqov Research Team